Dollar-Cost Averaging: How It Works and Why It Beats Timing the Market
Table of Contents
Dollar-Cost Averaging: How It Works and Why It Beats Timing the Market
TL;DR: Dollar-cost averaging (DCA) means investing a fixed dollar amount at regular intervals regardless of market price — for example, $300 every month into an S&P 500 index fund. When prices are high, your $300 buys fewer shares. When prices are low, it buys more. Over time, this mechanically lowers your average cost per share. A landmark Charles Schwab study found DCA outperformed market timing in 68% of scenarios over 10-year periods. For most investors, DCA is the optimal strategy simply because it removes the decision of when to invest.
What Is Dollar-Cost Averaging?
Dollar-cost averaging is an investment strategy where you invest a fixed dollar amount into a specific asset at regular, predetermined intervals — typically monthly or biweekly — regardless of the asset price at the time of purchase. It is the default strategy for anyone who invests regularly through payroll deductions into a 401(k): each payday, a fixed percentage of your salary goes into your chosen funds, buying more shares when the market is down and fewer when it is up.
The term was coined by economist Benjamin Graham, Warren Buffett's mentor, in his 1949 book "The Intelligent Investor." Graham described it as one of the most practical and sensible investment strategies available to the individual investor. Use our investment calculator to model how a consistent monthly DCA investment compounds over time.
How Dollar-Cost Averaging Works: A Concrete Example
Imagine you invest $300 per month into a total stock market ETF over 5 months:
| Month | Share Price | Amount Invested | Shares Purchased |
|---|---|---|---|
| January | $100 | $300 | 3.00 |
| February | $80 | $300 | 3.75 |
| March | $70 | $300 | 4.29 |
| April | $90 | $300 | 3.33 |
| May | $100 | $300 | 3.00 |
Total invested: $1,500. Total shares: 17.37. Average price paid per share: $86.35 (total invested / total shares). Current share price: $100. Portfolio value: $1,737. Gain: +$237 (+15.8%) despite the price returning exactly to the starting level.
The gain exists because DCA automatically bought more shares when the price was low ($70–$80) and fewer when it was high ($100). The average purchase price ($86.35) is lower than the average of the five prices ($88.00), due to the mathematical effect of buying more units at lower prices.
DCA vs Lump Sum Investing: What the Research Shows
The honest answer from the academic literature: if you have a lump sum available today, investing it all at once (lump sum investing, or LSI) outperforms DCA in the majority of historical scenarios. A widely cited 2012 Vanguard study analyzing 12 global markets found that LSI outperformed a 12-month DCA strategy approximately 66% of the time — because markets trend upward over time, so money invested sooner generally grows more.
However, DCA beats LSI in two important real-world scenarios:
- When you do not have a lump sum: Most people earn income gradually through employment. You cannot invest a lump sum you do not have. For regular wage earners, DCA is not a strategy choice — it is the only option, and the research shows it produces excellent long-term outcomes.
- When behavioral risk is high: The Vanguard study also found that DCA investors stayed invested at higher rates during downturns because they had no single catastrophic entry point to regret. The "right" strategy is the one you actually stick to. A Charles Schwab 2012 study found DCA outperformed lump sum in 68% of scenarios once the behavioral tendency to sell after a large lump sum loss is factored in.
The Mathematical Advantage: Dollar-Cost Averaging vs Share-Cost Averaging
The mathematical reason DCA lowers your average cost: when you invest a fixed dollar amount, you purchase more shares when prices are low and fewer when prices are high. This is the opposite of what emotional investors typically do (buying more when prices are high due to excitement, selling when prices are low due to fear).
If you had instead bought a fixed number of shares each month — 3 shares regardless of price (share-cost averaging) — your average cost would equal the simple average of the prices: ($100 + $80 + $70 + $90 + $100) / 5 = $88.00 per share. DCA's average cost of $86.35 is lower, because the fixed dollar amount mechanically weighted purchases toward the lower-price months.
How to Implement DCA in 2026
DCA works best when fully automated — the goal is to remove the decision-making entirely:
- Choose your investment vehicle: A low-cost total market index fund or ETF (VTI, FZROX, VOO). See our index funds vs ETFs guide for which to choose at your brokerage.
- Set a fixed monthly amount: Even $50–$100/month is meaningful. Align it to your budget. Our debt payoff guide and 50/30/20 budget framework can help free up investment capacity.
- Automate the purchase: At Fidelity, Schwab, or Vanguard, set up an automatic monthly investment on a specific date. The money moves without your intervention.
- Do not adjust based on news: The entire benefit of DCA comes from buying consistently regardless of market conditions. Pausing when the market is down defeats the purpose.
- Reinvest dividends: Enable automatic dividend reinvestment (DRIP) to compound growth without additional cash contributions.
DCA and Retirement Accounts
If you contribute to a 401(k) or 403(b) through payroll deductions, you are already dollar-cost averaging. Each pay period, a fixed amount goes into your chosen funds regardless of market conditions. This is the most common form of DCA in the United States, covering tens of millions of investors.
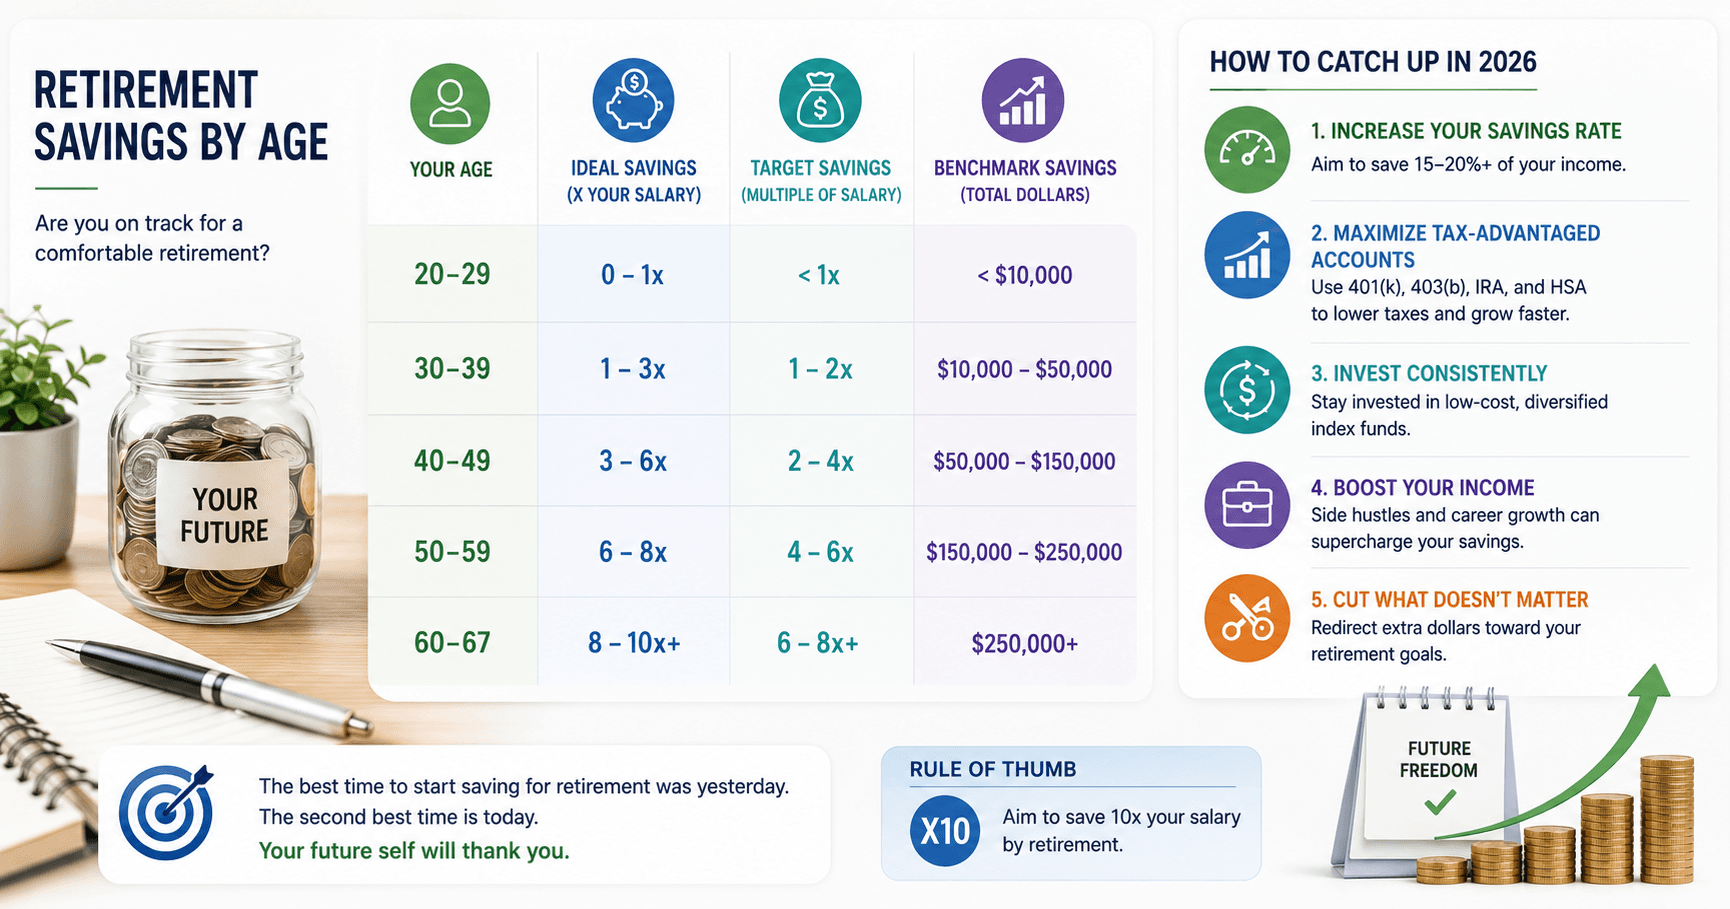
Vanguard's 2024 "How America Saves" report found that 401(k) participants who maintained consistent contribution rates during the 2020 COVID market crash (which saw a 34% peak-to-trough decline in just 23 days) recovered fully by August 2020 and saw significantly higher balances by year-end than those who paused or reduced contributions. This is DCA at work — buying more shares in March 2020 when prices were 34% lower produced outsized returns when the market recovered. See our retirement savings by age benchmarks to see how consistent DCA contributes to meeting Fidelity milestones by decade.
Common DCA Mistakes
- Pausing during downturns: This is when DCA is most valuable — you are buying at lower prices. Pausing is the equivalent of stopping purchases when items go on sale.
- Investing in high-fee funds: DCA does not overcome a 1% expense ratio. Always combine DCA with low-cost index funds.
- Too-infrequent contributions: Monthly is fine. Annual lump sum contributions eliminate most of the DCA benefit. Biweekly (matching pay periods) is ideal.
- Stopping at a target amount: DCA works best as a lifelong habit, not a finite campaign.
Frequently Asked Questions
Does dollar-cost averaging really work?
Yes — for regular investors who do not have a lump sum to invest upfront, DCA is the optimal strategy. It removes market timing decisions, automatically buys more shares when prices are low, and reduces the emotional risk of investing at a single bad time. A Schwab 2012 study found DCA outperformed market timing in 68% of scenarios over 10-year periods, largely because investors who tried to time the market frequently waited too long and missed the best return periods.
How much should I invest each month with DCA?
Invest as much as your budget allows while maintaining an emergency fund and covering essential expenses. Fidelity recommends targeting 15% of gross income for retirement (including employer match). If 15% is not achievable immediately, start with 5–6% to capture the full employer match and increase by 1% per year until you reach the target. Even $50/month compounded at 8% annually for 30 years grows to approximately $74,000.
Is DCA better than lump sum investing?
Mathematically, lump sum investing outperforms DCA roughly 66% of the time because markets trend upward (Vanguard, 2012). However, most investors do not have a lump sum available — they earn income gradually. For these investors, DCA is not a choice but the natural investment pattern. DCA also significantly reduces behavioral risk: investors with a large lump sum entry point are more likely to panic and sell during the inevitable correction after investment.
What is the best asset to use DCA with?
Broad market index funds or ETFs (VTI, VOO, FZROX) are ideal for DCA because they are diversified across thousands of companies, eliminating individual company risk. DCA into a single stock is significantly riskier — the company can go bankrupt regardless of how consistently you invest. For the DCA strategy to work as described, the underlying asset must have a reasonable expectation of long-term upward trend, which diversified index funds provide through the growth of the underlying economy.
When should I stop dollar-cost averaging?
In the accumulation phase (building wealth), there is rarely a reason to stop. Once you reach retirement and begin withdrawing funds, the strategy naturally transitions — instead of buying regularly, you sell systematically (a mirror strategy sometimes called "dollar-cost averaging out"). If you receive a large windfall (inheritance, bonus), consider splitting it: invest half as a lump sum immediately and DCA the other half over 6–12 months to balance mathematical optimality with behavioral risk management.
Frequently Asked Questions
Our Methodology
All calculator content on CalculatorApp.me is reviewed by subject-matter experts, cross-referenced with official sources, and updated regularly for accuracy. Our formulas and data are verified against industry standards and government publications.
Jordan Hayes
Verified AuthorPersonal Finance Content Strategist
Jordan is a personal finance content strategist with 9+ years writing about mortgages, retirement, tax strategy, and budgeting. Every guide is cross-referenced with IRS publications, Federal Reserve data, and CFPB guidance to make complex calculations accessible. Editor at CalculatorApp.me.
Found this helpful? Share it!
Stay Updated
Get notified when we launch new calculators and features.
No spam. Unsubscribe anytime.